Report - NDIS Quarterly Report: Quarter 3, 2014-15
Every three months the NDIS releases a report about how the trial sites are going. This is called the Quarterly Report.
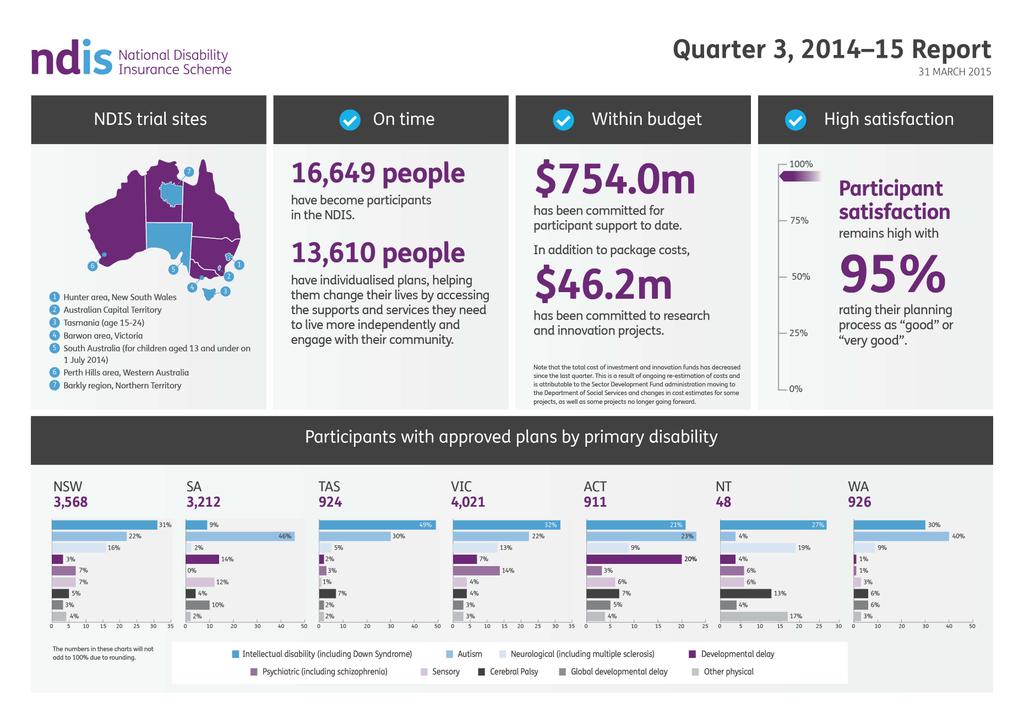
Yesterday Assistant Minister for Social Services Mitch Fifield announced that the NDIS have just released a new Quarterly Report, which shows that the NDIS is being delivered on time, within budget, and with high satisfaction from the people who use it.
Assistant Minister Fifield also said there would be more information about how the NDIS will be rolled out available in August 2015.
The picture below shows lots of facts and figures from the Quarterly Report. There are 16,649 people with disability who are using the NDIS, with a 95% satisfaction rate. Continure reading below the image for a transcript of the infographic.
Download the report as a PDF or DOCX from the NDIS website here.
Infographic transcript:
Quarter 3, 2014-15 Report
31 March 2015
NDIS trial sites
Image - map of Australia, with states & territories outlined; trial sites are labelled with blue fill.
- Hunter area, New South Wales
- Australian Capital Territory
- Tasmania (age 15-24)
- Barwon area, Victoria
- South Australia (for children aged 13 and under on 1 July 2014)
- Perth Hills area, Western Australia
- Barkly region, Northern Territory
On time
16,649 people have become participants in the NDIS
13, 610 people have individualised plans, helping then change their lives by accessing the supports and services they need to live more independently and engage with their community.
Within budget
$754.0m has been committed for participant support to date.
In addition to package costs, $46.2m has been committed to research and innovation projects.
Note that the total cost of investment and innovation funds has decreesed since the last quarter. This is a result of ongoing re-estimation of costs and is attributable to the Sector Development Fund administration moving to the Department of Social Services and changes in cost estimates for some projects, as well as some projects no longer going forward.
High satisfaction
Image - chart displaying 0-100%; purple line at the 95% mark.
Participant satisfaction remains high with 95% rating the planning process and “good” or “very good”.
Participants with approved plans by primary disability
The numbers in these charts will not add to 100% due to rounding.
NSW
3,568
31% Intellectual disability (including Down syndrome)
22% Autism
16% Neurological (including multiple sclerosis)
3% Developmental delay
7% Psychiatric (including schizophrenia)
7% Sensory
5% Cerebral palsy
3% Global developmental delay
4% Other physical
SA
3,212
9% Intellectual disability (including Down syndrome)
46% Autism
2% Neurological (including multiple sclerosis)
14% Developmental delay
0% Psychiatric (including schizophrenia)
12% Sensory
4% Cerebral palsy
10% Global developmental delay
2% Other physical
TAS
924
49% Intellectual disability (including Down syndrome)
30% Autism
5% Neurological (including multiple sclerosis)
2% Developmental delay
3% Psychiatric (including schizophrenia)
1% Sensory
7% Cerebral palsy
2% Global developmental delay
2% Other physical
VIC
4,021
32% Intellectual disability (including Down syndrome)
22% Autism
13% Neurological (including multiple sclerosis)
7% Developmental delay
14% Psychiatric (including schizophrenia)
4% Sensory
4% Cerebral palsy
3% Global developmental delay
3% Other physical
ACT
911
21% Intellectual disability (including Down syndrome)
23% Autism
9% Neurological (including multiple sclerosis)
20% Developmental delay
3% Psychiatric (including schizophrenia)
6% Sensory
7% Cerebral palsy
5% Global developmental delay
4% Other physical
NT
48
27% Intellectual disability (including Down syndrome)
4% Autism
19% Neurological (including multiple sclerosis)
4% Developmental delay
6% Psychiatric (including schizophrenia)
6% Sensory
13% Cerebral palsy
4% Global developmental delay
17% Other physical
WA
926
30% Intellectual disability (including Down syndrome)
40% Autism
9% Neurological (including multiple sclerosis)
1% Developmental delay
1% Psychiatric (including schizophrenia)
3% Sensory
6% Cerebral palsy
6% Global developmental delay
3% Other physical